YAMon - arguably the most popular usage monitoring tool...
I started working on YAMon in the spring of 2013 when my ISP could not explain how we kept exceeding our monthly usage cap.
In short, I did not trust their totals and their reports did not provide the level of detail I wanted to see - i.e., who used how much data when?
Their best response seemed to be that I should upgrade to the next tier of service which included a higher cap (and higher speeds)... and I quickly learned that that just meant that we could exceed the new allowance faster.
So I started to look for a way to better monitor the usage on our router... not just the total traffic but the uploads and downloads on a per user basis. The graphs & tables in the `stock` firmware on my router offered a little more information than my ISP but not in a format or to the level of granularity I wanted.
I read that the DD-WRT firmware had some interesting solutions so I had to learn how to `flash` my router and get up to speed on Linux, bash scripts, etc. The scripts I found via the DD-WRT forum were closer to what I wanted but, again, none of them provided the simplicity, and/or information I really to see. So, using `wrtbwmon` by Emmanuel Brucy & `bw_monitor` by FezJay as a base, I built YAMon (short for Yet Another Monitor... true story: the abbreviation was actually inspired by a video of a now-deceased but then drug-addled Canadian politician/embarassment).
- YAMon consists of two distinct pieces:
- Bash scripts which run on your router and produce the data files necessary for the reports
- HMTL, JavaScript & CSS files which illustrate the traffic in various tables and graphs
To run YAMon, you will require a router with a USB port that has had its stock firmware replaced with one of the following:
![]()
![]()
![]()
![]()

YAMon will be downloaded over 9,000 times in 2017. The usage-monitoring.com site will get close to 3 million hits in 2017! The YAMon threads at the DD-WRT forum have been viewed well over 1.2 million times! I've recently added a page that shows a breakdown of the router and firmware tallies. The site traffic page has a couple of graphs showing the growth of traffic at this site.
Input from users around the world and through the DD-WRT, Turris and OpenWrt/LEDE forums has allowed me to evolve YAMon so that it is capable of handling virtually any ISP services package (unlimited data, data caps, `bonus` data intervals (both unlimited and capped), etc. and most common router/network configurations. YAMon is one of the only tools of this sort that can also report on IPv6 traffic.The reports provide visibility into hourly, daily, monthly (actually per ISP billing interval) data usage. You can incorporate the usage totals as tallied by your ISP right into the YAMon reports so that you can do a side by side comparison. A live usage report shows all active connections and provides a geo-location lookup so you can see where those connections are located.
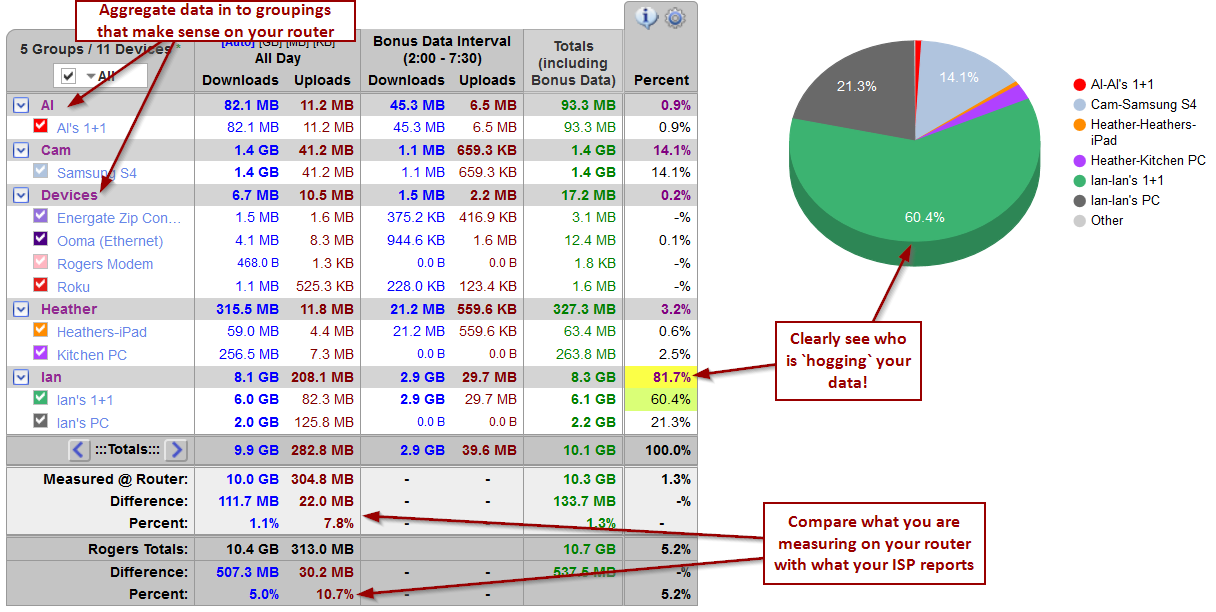
See what devices are on your network (and group them accordingly):
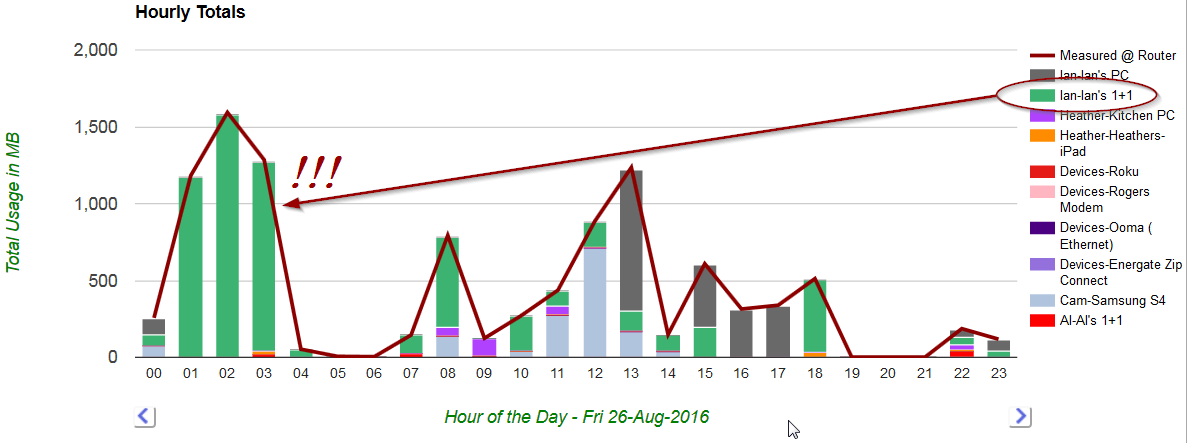
See when the traffic is being used:
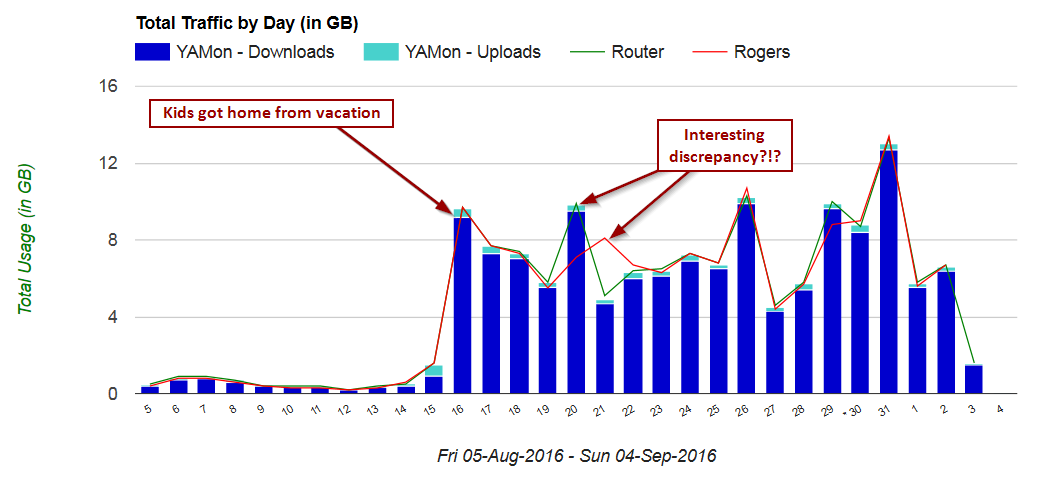
Compare the numbers you are getting on your router with those provided by your ISP: